Data Watch
Data Watch is designed to allow you to quickly and easily audit the destinations that your site is sending data and get notified as soon as new ones are detected. Useful for being alerted about Magecart style attacks and other data exfiltration scenarios, you can get started with Data Watch easily.
Getting Started
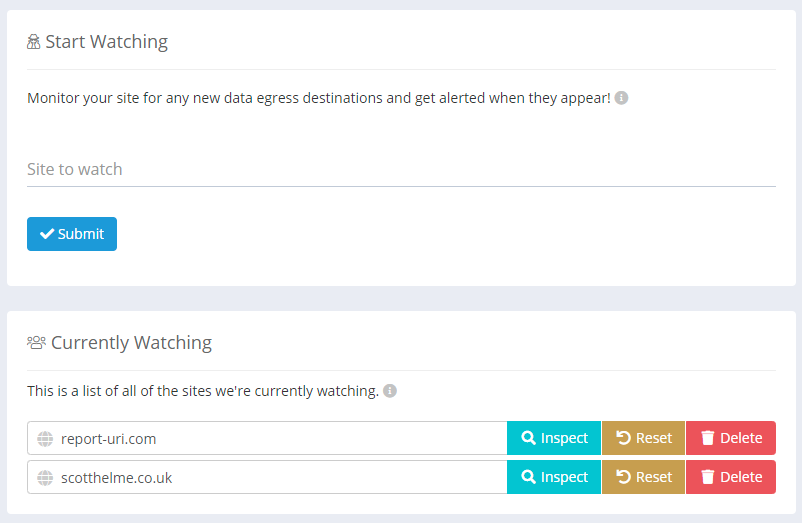
If you already have a CSP setup on your site, either in Enforce mode or Report-Only mode, you can get started with Data Watch in just a few seconds. Head to the Data Watch menu item located under the CSP menu in your account. Here you can see any sites you're currently monitoring for data egress or add a new site to monitor.
We allow granular control of the sites you wish to monitor and as an example, www.report-uri.com and blog.report-uri.com would be two different sites and monitored/alerted separately from each other. This means you can setup monitoring and only receive alerts for the areas of your site that interest you.
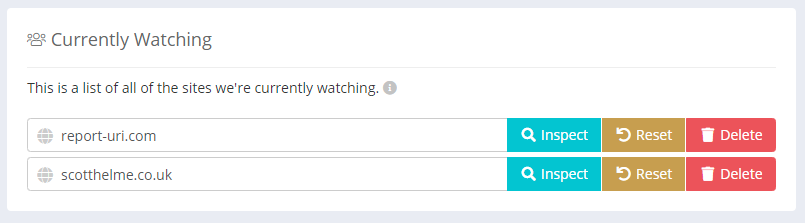
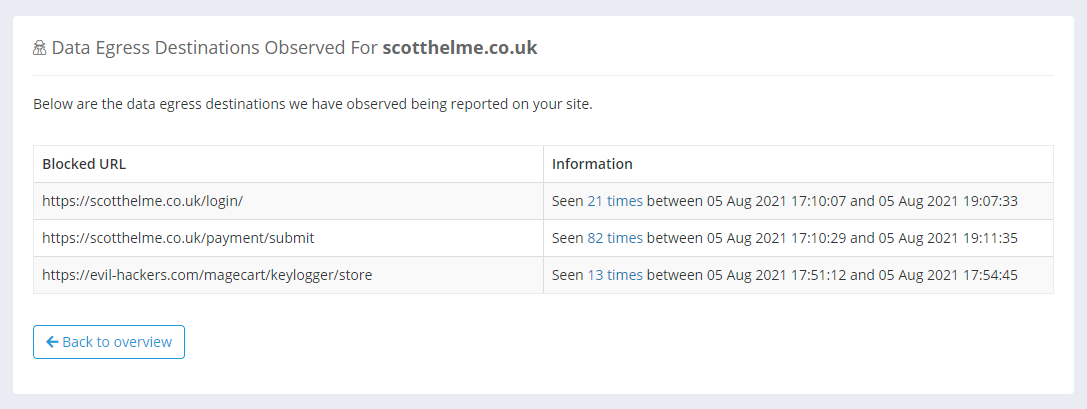
If you add a new site to be monitored by Data Watch, we will start analysing all inbound reports for that site to audit your data egress and send alerts when new destinations are detected. Data egress destinations for any given site can be viewed by clicking the Inspect button.
This will show all the data egress destinations we have detected for your site.
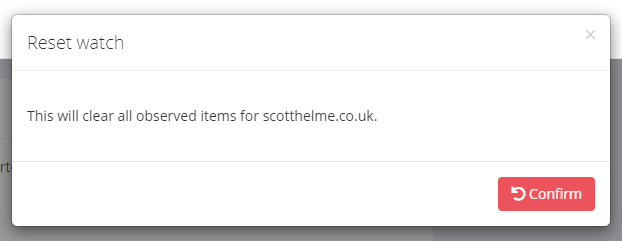
The Reset button will clear our list of destinations and start the monitoring process again. This may be helpful if you've made changes to your site and would like to rebuild a fresh list of your destinations.
The Delete button will delete the site from Data Watch, removing all data with it, and will stop ongoing monitoring and alerting for this site.
Data Watch Setup
If you do not have an existing CSP on your site, there are several ways you can get started with Data Watch.
If you would like to build a fully functional CSP first, then we recommend the CSP Wizard. Once you have a CSP setup you can then enable Data Watch to monitor your reports.
If you would like to use Data Watch to audit and monitor your data egress without having to create a fully functional CSP first, there are some options. A CSP deployed in Report-Only mode can be used to audit and monitor all of your data egress on an ongoing basis with minimal effort.
Content-Security-Policy-Report-Only: default-src * 'unsafe-inline' 'unsafe-eval'; connect-src 'none'; form-action 'none'; report-uri {URL}
This policy is delivered in a CSPRO header so no blocking action will take place, but reports will be sent for all data egress on your site so that Data Watch can monitor the destinations. As it should be relatively safe to send data to your own site, you could also start with the following policy instead. Changing connect-src 'none' to connect-src 'self' and form-action 'none' to form-action 'self' will allow data to be sent to your own site, so it won't be reported.
Content-Security-Policy-Report-Only: default-src * 'unsafe-inline' 'unsafe-eval'; connect-src 'self'; form-action 'self'; report-uri {URL}
This policy will generate more reports than usual, but you can quickly reduce the volume of reports to save your monthly quota from being consumed too aggressively. By allowing any expected endpoints in your CSPRO header, reports will no longer be sent for them.
Content-Security-Policy-Report-Only: default-src * 'unsafe-inline' 'unsafe-eval'; connect-src 'self' comment-system.com; form-action 'self' payment-provider.com; report-uri {URL}
As we have added comment-system.com to our connect-src, a user submitting a comment on our website will no longer trigger a report. Likewise, by adding payment-provider.com to our form-action, users submitting a payment will not trigger a report either. The volume of reports sent will now be greatly reduced and ongoing Data Watch monitoring for new data egress destinations will be just as effective.
The Reporting API
If you have setup the Reporting API on your site then you can use it to send CSP reports which will continue to be monitored via Data Watch. Simply add the report-to directive to your policy as usual, there are no support considerations.
Configuring a Watcher
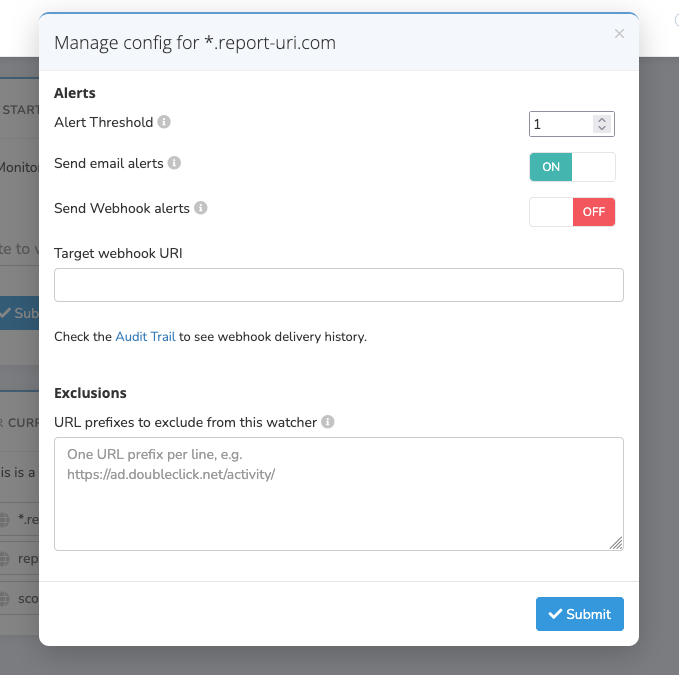
Every watcher has a Config button on its overview row, alongside Inspect, Reset, and Delete. It opens the Config modal, where you control how and when the watcher alerts you. Only a Team Owner or Team Admin can change these settings.
Alert Threshold
The number of new observations required before an alert is sent, from 1 to 100. The default is 1, so you are notified the first time a new destination is detected. Raise it if you would rather only hear about a watcher once it has accumulated several new observations — useful on noisier sites where a single new entry isn't worth an alert. The threshold applies to both email and webhook alerts.
Send email alerts
Email alerts are on by default. Turn this toggle off to stop email notifications for this watcher while it keeps monitoring — for example, if you would rather receive webhook alerts only. Email alerts are sent to your account's notification address.
Send Webhook alerts
Available on Business plans and higher. Enable the toggle and set the Target webhook URI to receive an HTTP POST for each new detection. See the Webhooks page for the payload format and examples. Webhook delivery history is recorded in your Audit Trail.
Exclusions
Exclusions are a per-watcher list of URL prefixes that suppress matching reports at observation time. They are available on Script Watch, Data Watch, and Frame Watch (not Policy Watch).
Each line is a literal URL prefix matched against the start of the reported URL. Scheme and host are matched case-insensitively (https://Example.com/ behaves the same as https://example.com/); path and query are matched case-sensitively. Any reported URL that starts with a listed prefix is excluded entirely — no observation is recorded, no alert is sent, and no entry appears on the Inspect page.
You can add up to 50 exclusions per watcher, each up to 100 characters. Invalid lines (an unparseable URL, a scheme other than http/https, a missing host, or an over-length line) and any lines beyond the cap are dropped when you save, and a notice tells you how many were rejected.
For example, an exclusion of https://ad.doubleclick.net/activity/ matches https://ad.doubleclick.net/activity/12345 and https://ad.doubleclick.net/activity/N4567890123/ but not https://ad.doubleclick.net/different-path/. Use exclusions to suppress noisy URLs — build-hash CDN assets, A/B-test injected scripts, advertising trackers with rotating paths, third-party query-string variations — that would otherwise repeatedly trip the watcher's new-observation alert.
Exclusions don't remove observations that are already stored, and they won't unbreak a watcher that has reached capacity — for that, use Reset. What they do is stop the same noise from re-filling the watcher afterwards, so they pair well with a reset as a recurrence-prevention step. On a wildcard watcher, the exclusions list applies uniformly across every matched host; to suppress something on just one sub-host, create a dedicated exact-host watcher (which takes precedence over the wildcard).
Useful Links
For more details on Data Watch, check out the launch blog post: https://scotthelme.co.uk/introducing-data-watch-detect-magecart-style-attacks-fast/
Start Monitoring with Report URI
Already using us? Manage your monitored sites on Data Watch.
New to Report URI? Data Watch requires a Business plan or higher, or try it free during your trial month — create a free account to get started.